One of the best ways to save energy is to move to a smaller house. Heating a larger house takes a larger amount of energy – floor area accounts for 70% of variation in space heating demand, as modelled by the CHM [1]. According to the Bedroom Standard (see below), 4.4% of homes are over-crowded but 69% are under-occupied [2]. If you allow one spare room then that number reduces to about 36% but that is still a lot! If everyone lived in a home the right size, we would overall need less heating energy. Obviously this is a hopeless ideal – but could we get some of the way there?
Showing posts with label home energy. Show all posts
Showing posts with label home energy. Show all posts
Wednesday, 4 September 2024
Tuesday, 14 February 2023
Avoiding the rated power fallacy
How much energy does an oven use? Today I have seen examples both on the BBC Food Programme and on the Uswitch website [1] where this question was answered by multiplying rated power by hours of use. This is totally wrong because ovens have thermostats. They turn the power off when they are up to heat. The power of the oven is mainly used during the initial heating phase. After that it turns down the heating and/or cycles on and off.
 |
| Screenshot from Uswitch [1] As well as falling for the rated power fallacy Uswitch has confused watts (power) and watt-hours (energy). |
Saturday, 5 February 2022
Energy price increases - and the impacts for heat pumps.
Most reporting on the changes to energy price caps that come into force from April are about dual fuel bills and just report the total bill, not separating gas and electricity. However, if you are considering switching to a heat pump you are also interested in the ratio between gas and electricity costs - how much will it cost you to make that switch? Currently, heat pumps typically cost a little more to run than a gas boiler, but from April the gap narrows - plausibly to nothing in many cases.
The data behind this blog comes from OFGEM.
Firstly, the typical bill - there are slightly different costs for payment methods and I have assumed a standard credit payment. I am also using Eastern prices. There are regional differences but these too are small.
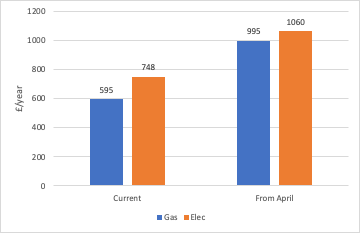 |
| Price cap for gas and electricity, whole bill £/year. This is based on 12000 kWh/year for gas and 3100 kWh/year for electricity. |
Saturday, 29 May 2021
Savings on bills and carbon with TOU tariffs
Converting our heating and transport energy to electricity increases demand which puts strain on the grid. However, it is primarily the peak demand that is the problem, so shifting demand away from the peak times helps a lot. When demand is high, wholesale prices and carbon emissions are usually also high, because we need to use less efficient power sources to top up supply. However there are other factors that affect prices and emissions.
It is possible to take advantage of these differences by switching to an electricity tariff that offers higher prices at peak times and lower prices at times of low demand. In this post I compare two: Tide from Green Energy, which has three tariff levels through the day and Agile from Octopus which follows wholesale prices directly (at least for now). I look at both price differences and the carbon savings from shifting your demand away from peak times to the cheapest times. Shifting demand is easiest with a battery.
Wednesday, 20 January 2021
How have we reduced our domestic energy use?
Domestic energy bills have reduced about 20% over the last decade - in terms of energy used. We have reduced consumption in lighting, refrigeration, TV and electronics. Unfortunately, prices have risen such that the overall bill has often increased – probably that is one of the reasons why we are using less, to save money. In this post I attempt to dig deeper into the mechanisms behind these changes and see what lessons can be learnt.
Friday, 15 November 2019
What next for the 2050 Pathways calculator?
The 2050 Pathways Calculator was a tool to help us understand how to reduce our CO2 emissions by policy changes and behaviour shifts across all sectors of the economy. It was originally developed by the Department of Energy and Climate Change for the UK and launched in 2010 – and then adapted for other countries and a global one. The UK one is out of date now but new versions are in active use by policy makers in governments, by children in schools, by NGOs and individuals. Last Thursday I spent a day at a conference about them, with delegates from all over the world – Mexico and the USA, Malaysia, and Thailand, India, Nigeria and many from Europe too. There is a new UK calculator in the pipeline and one for the EU - both are bigger, better and easier to use.
Wednesday, 30 October 2019
Upgrading our electricity distribution networks.
Electricity North West plans to reduce the voltage of their customers' electricity supply which will reduce bills by up to £60/year - and be hardly noticeable except it will take a little longer to boil the kettle [1]. In this post I take a look at the Smart Street trial they have run to test out their concept [2]. As well as energy savings a key purpose of the trial was to evaluate new voltage regulation equipment that could delay the need to upgrade the distribution network. Reducing the voltage reduces the delivered energy and peak load, so the existing infrastructure can cope for longer.
Savings on customers bills are welcome but even more importantly (for climate change) we need to be able to install more distributed generation and run bigger loads due to heat pumps and electric vehicles. How much will that cost? A case study on low carbon heating in a town in Scotland has some answers to that [3]. The cost of the network was much less than I expected - much less than the heat pumps anyway.
Savings on customers bills are welcome but even more importantly (for climate change) we need to be able to install more distributed generation and run bigger loads due to heat pumps and electric vehicles. How much will that cost? A case study on low carbon heating in a town in Scotland has some answers to that [3]. The cost of the network was much less than I expected - much less than the heat pumps anyway.
Sunday, 13 October 2019
Where does your renewable energy come from?
Did you know that the renewable energy you are paying for with your green energy tariff does not actually have to be generated in this country - or even supplied to this country? For example it is quite possible your green electricity usage has been matched with generation in Italy. In the year to April 2019, 16 TWh of renewable energy certificates were imported into this country, almost half from Italy. This only adds around 15% to the green energy generated in the UK - but it does make you wonder if it is worth getting a green energy tariff at all. Fortunately some electricity companies either generate their own or buy direct from UK generators.
Tuesday, 16 April 2019
A case for energy services - spreading the risk.
Recently I have completed some research into how cost-effectiveness of energy efficiency is measured and was struck by the huge differences we see, depending on context. For a householder or a small business, cost effectiveness is normally considered around financial costs and savings, with a time horizon of up to five years. In a context of evaluating national housing stock upgrades, the UKERC, for example [1], consider additional wider benefits including air quality, thermal comfort and carbon emissions, and a much longer timescale, at least 20 years. This is by no means exceptional - I found evaluations based on up to 60 years.
Risk gets too little attention.
However, it is not just the addition of non-monetary benefits and long timescales that worries me, the issue of risk gets too little attention, in my view. It is very hard to predict actual energy savings from retrofits due to a variety of factors, from inadequate understanding of the structure already present to variable installation quality. The recommendations we get on energy certificates have an allowance called the 'in-use' factor that partly covers these uncertainties - but these factors are based on averages. Also the in-use factor excludes comfort taking, which may or may not be due to actual changes in control settings by the occupants (see also my review of 'The Rebound effect in Home Heating' by Ray Galvin). This means that estimates of financial savings have a large element of uncertainty.
EnergieSprong's performance guarantee is a promising strategy.
While I would not wish to discourage anyone from installing energy efficiency improvements in their home, I would hesitate to recommend this purely on a cost saving basis, at least without an assessment of uncertainty or some kind of performance guarantee. This is why I find the EnergieSprong initiative interesting. The concept has apparently been working well in the Netherlands and is now coming to the UK, with an initial pilot in Nottingham [2].
Friday, 23 June 2017
More energy label confusion coming
Under the EU energy label scheme appliances were originally labelled A-G with A as the best. Then as standards improved new grades were introduced: A+, A++ and for some products we now have A+++; apparently this is confusing. So the EU is updating the scheme with a rescaling so everything goes back to A-G: they say this is simpler. However, during the changeover period we will see two kinds of labels which is going to be even more confusing. Fortunately for most products there is other information on the label that you can use to compare products by actual energy consumption. Unfortunately this is not so for heaters, which only show the energy class and even this means different things for different types of heater.
Tuesday, 13 June 2017
Reasons why your freezer may be using too much electricity
Back in 2014 I reported some shockingly high energy use in a minority of freezers and fridges [1]. This was from a study of electrical appliances in general and there were only about 130 cold appliances in the sample. Now there has been a much bigger study with 998 fridges and freezers, conducted by BRE [2]. It has confirmed the earlier findings and provided more information as to the causes of the problem. In some cases the appliance was faulty but half the time the main cause was simply running on fast freeze or maximum setting all the time.
This problem mainly affects freezers. 25% of chest freezers were over-consuming and 12% of upright freezers.
This problem mainly affects freezers. 25% of chest freezers were over-consuming and 12% of upright freezers.
Thursday, 25 May 2017
Do modern homes overheat more than older ones?
Modern homes have a reputation for overheating more than old ones partly because they tend to be more airtight and partly because they are often more lightweight constructions that heat up quickly. However, overheating is not an inevitable consequence. For example features such as green roofs and external window shades can make a huge difference – but apparently ‘people are resistant to changes to the aesthetic of the homes and other buildings they occupy’ and these features ‘may be resisted by house buyers’ – so builders won’t build them [1]. Is it all our own fault then?
Tuesday, 18 April 2017
5 year carbon savings advice review: changes
Five years ago I devised some 'carbon saving' cards to engage people at event stalls, with ideas like 'Switch your TV off when you are not watching', 'Run the dishwasher only when it full', 'Draught strip a leaky front door', 'Eat a vegan meal once a week', 'Keep your phone for 3 years before replacing it'. As I am doing a similar stall this Saturday (at the Earth Optimism Solutions Fair) I decided to review the cards - and found big changes to carbon savings from some of the activities. Should the advice we give change too?
The cards that have changed are mainly to do with electrical or electronic appliances and the emissions have changed for several reasons.
The cards that have changed are mainly to do with electrical or electronic appliances and the emissions have changed for several reasons.
Wednesday, 15 February 2017
No, smart meters will not make you ill
I was recently invited to sign a 38 degrees petition against smart meters primarily on health and safety grounds. This made all sorts of spurious claims about the health impacts of radio waves used to propagate smart meter data. A friend who also got the same invite wasn't sure what to believe and another acquaintance seems to be convinced that the government and utility companies are conspiring to make us all ill with smart meters. This is ridiculous.
Thursday, 5 January 2017
What would a smart time of day tariff do for me?
Green Energy UK has just announced a new electricity tariff called TIDE which varies by the time of day [1]. For many people this will save money because the tariff is cheap at weekends. The time to avoid is 4-7pm on weekdays when electricity costs are higher. It is hard to know what this would mean for your particular household unless you have detailed knowledge of your electricity use. If you have a smart meter this information ought to be available but your in house display probably is not clever enough to give it to you - you need more advanced viewing tools. In this post I use electricity use profiles from a detailed study of different kinds of households to see what the costs would be.
Tuesday, 1 November 2016
Energy saving week tips
It is energy saving week. If there is one time of year when you think about saving energy, this is a good time to do it because there is lots of advice out there. (If you live in or near Cambridge, you could go to the central library and get Tania to show you tools to help you. Also she can show you the pilot version of DAREED, a city-scale smart energy management tool - the current version is underwhelming but I can see the potential.)
Thursday, 11 August 2016
Our personal energy use matters
A friend recently complained to me that it was pointless trying to save energy at home because our domestic energy use is a tiny proportion of the overall impact from business and industry - whatever we could do personally would not make any difference. This post refutes her statement, at least for the UK. Depending on how you count things, between 25% and 33% of greenhouse gas emissions are due to our activities at home and for personal travel.
The first figure is based on statistics recently released by DEFRA on greenhouse gas emissions by final consumption - this includes emissions due to imported goods and excludes emissions due to imports. The second figure is based on emissions generated within the UK. The chart below shows my best estimates for emissions on personal consumption in 2014. It shows a fairly even split between heating, electricity use, car travel and air travel. Together these add up to 3.7 t COe.
The first figure is based on statistics recently released by DEFRA on greenhouse gas emissions by final consumption - this includes emissions due to imported goods and excludes emissions due to imports. The second figure is based on emissions generated within the UK. The chart below shows my best estimates for emissions on personal consumption in 2014. It shows a fairly even split between heating, electricity use, car travel and air travel. Together these add up to 3.7 t COe.
Sunday, 24 July 2016
Never mind the EU - we still need smart meters
Now that we are leaving the EU we don’t have to go ahead with the smart meters rollout [1]. However, the reasons why smart meters were proposed in the first place have not gone away. Smart meters are vital for a truly responsive electricity market. British Gas are leading the way on this, offering their smart meter customers free electricity at weekends, when demand is normally low [2].
Smart meters get a bad press because they don’t save much money by themselves. However they are a vital bit of technology that enables a whole raft of other savings possibilities.
Smart meters get a bad press because they don’t save much money by themselves. However they are a vital bit of technology that enables a whole raft of other savings possibilities.
Monday, 27 July 2015
How much does your bath or shower cost?
When we have a bath or a shower we don't just pay for heating the water, we have to pay for the water too (if we have a metered supply). Taking both into consideration, I was surprised to find that the water costs more than heating it! In fact, assuming you heat by gas with a reasonably efficient system, only about 40% of the cost of your shower or bath is for the heating. In Cambridge, the total cost of an average bath is about 36p and a shower probably 9-22p - depending on the amount of time you spend in the shower and the flow rate. These figures are shown in the chart.
 |
| Cost of bath/shower etc. in Cambridge. The assumptions are discussed below. |
Thursday, 11 June 2015
Why are we still designing buildings for yesterday’s climate?
Homes and buildings constructed today are very likely to be still in use 50 or even 100 years from now. (My home is 118 years old). So it would be sensible to design them to handle the climate that we can expect then, with warmer and drier summers and more frequent heat waves. However our current building regulations are more concerned with keeping us warm in winter than keeping us cool in sweltering summers. Plus the calculations they stipulate are based on historic weather patterns that are already out of date[1]. Between 1965 and 2006 the summertime daily mean temperature in the South East increased by 1.8°C and the daily maximum temperature increased by 2.0°C [2]. We can expect another couple of degrees on top of that at least.
 |
| External louvres on the top window and the overhang on the bottom window give shade that helps keep this home cool. Picture from openecohomes.org |
Subscribe to:
Posts (Atom)