- Most NOx pollution in cities comes from traffic, mainly from burning petrol or diesel (especially diesel).
- NOx dissipates fairly quickly.
- Particulates (especially PM2.5) are partly related to traffic (including chemical reactions with NOx) but there are other sources.
- Particulates can waft around and travel for long distances. Most of the particulates pollution in Cambridge comes from outside the city.
What this means is that while reducing traffic in the city, especially diesel cars, will reduce NOx levels, they will have less of an impact on particulates. Tackling that requires action across the region, not just the city.
NOx levels vary through the day while particulates are relatively steady
Cambridge has several automatic air quality monitoring stations and I have downloaded data [2] for two of them: Gonville Place and Newmarket Road. (You can see the locations on a map here). Pollution is bad in these places which is why they have been selected to have monitoring equipment. The chart below shows how the NOx, PM10 and PM2.5 vary through the day, averaged over last month for Gonville Place.
 |
| Air pollution data from [2]. All units are µg/m3. |
You can see NOx levels rise sharply in the morning rush hour, tail off slightly during the day, rise in the evening and then drop overnight. In the meantime, the particulates are fairly steady.
Monitored roadside NOx levels are 4-6 times the background level, while particulates are only slightly increased.
DEFRA publishes maps of background air pollution in 1km squares [3]; the total pollution is this plus local sources. The table below shows the average levels of NOx and PM2.5 at the monitoring station compared to the background levels in 2015 - since these vary (especially for NOx) across the Cambridge area as well as the mean I have given the minimum, i.e. the cleanest in this area.
| Where | NOx (1) | PM2.5(1) |
|---|---|---|
| Gonville Place | 64.1 | 14.0 |
| Newmarket Road | 48.8 | 9.8 |
| Background mean | 18.4 | 9.4 |
| Background minimum | 12.5 | 8.9 |
| Background minimum excluding in-square sources (2) | 12.4 | 8.6 |
| EU permitted annual average [4] | 40 | 25 |
(2) The DEFRA maps indicate how the levels are made up of various sources. For this row I have subtracted 'in square' sources from the total background level. This removes emissions due to roads, rail, aircraft, industry and domestic sources that are within the 1km square.
For PM2.5, Cambridge is little different from the East of England but Wales is much cleaner
The background level of PM2.5 in Cambridge is not much different to the surrounding area. Across South Cambs as a whole the minimum background level is a little lower, at 8.5, and across the East of England it is down to 6.8. The minimum in Wales is 4.4.
Particulates are within legal limits but only just within WHO guidelines
Both Cambridge locations are above the legal limits for NOx but are well within the limit for PM2.5 and the background levels are well within limits. However, these limits are not necessarily healthy. There is no safe level for particulates, though as there are plenty of natural sources as well as man made ones it is impossible to test this in a normal environment. The WHO recommends a lower limit than the EU; they suggest 10 µg/m3 rather than 25 [5]. Even the background level is close to this.
High levels of NOx affect people who work on or near busy roads.
NOx levels at the monitoring stations are at four or more times the background level showing plenty of scope for improvement. However this impact is likely to be very local and will affect people who work outside in the road or in buildings very close by. The image below, shows NO2 levels around the city - you can see how they are concentrated around major roads. (This data is from models rather than measurements.)
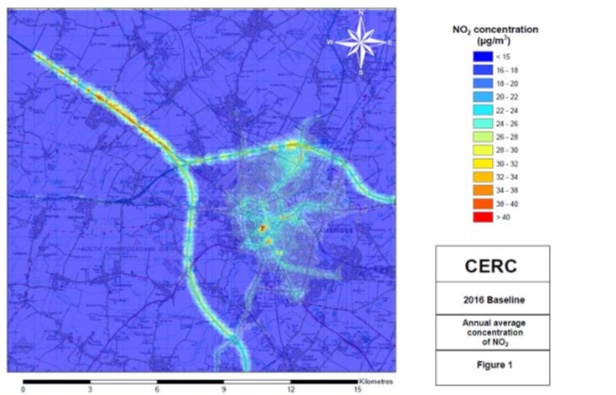 |
| Image shows modelled NO2 concentrations around Cambridge. From [1] Red is above the legal limit. |
Most people are exposed to similar levels of particulates
The levels of PM2.5 at the two monitoring points are less than 50% more than the background level and excluding the in-square sources makes little difference to the background levels - this suggests that most of the sources are further away. There is more evidence for this in the good agreement between levels at the two sites. Looking at the hourly measurements through the year, PM2.5 correlates much more strongly than NOx levels. (Pearson correlation is 0.91 for PM2.5 and only 0.51 for NOx.)
Vehicles contribute to PM2.5 in several ways, especially diesel and petrol engines
The main sources of background particulates in Cambridge (according to DEFRA) are shown in this table.
| What | level | cumulative level |
|---|---|---|
| Particles created by chemical reactions e.g. with NOx and SOx | 4.1 | 4.1 |
| Salt and dust e.g. from soils | 4.1 | 8.2 |
| Domestic burning | 0.33 | 8.5 |
| Industry | 0.25 | 8.75 |
| Other including vehicle engines, brake and tyre wear, and road abrasion from traffic | 0.65 | 9.4 |
Diesel and petrol engines contribute in different ways but the actual levels are uncertain. These figures suggest that direct emissions of particulates from engines, brakes and tyres are less important than that secondary particles created by chemical reactions. Diesel engines emit more NOx than petrol engines but they are both implicated.
Weather affects levels of particulates: high in cold weather, lower when the wind is from WSW.
The levels of particulates do vary from day to day (as do the NOx). Part of this is weather related. Wind from the WSW seems to reduce the particulate levels - could this be because the air is cleaner when it comes from Wales? Cold weather lead to increased particulates; this could be due to people using wood fires or to increased traffic, probably both. Rain has only a minor impact but it tends to decrease the levels, which suggests the washing out of the air effect just overrides the increased traffic.
My verdict
Air pollution in Cambridge is no worse than many other places but that does not mean it is not a problem. High levels of particulates affect everyone, not just people living and working near busy roads. But reducing particulates is going to be hard, because they persist and waft across a wide area. It is difficult to determine how much of the particulates are natural, how much are due to traffic and other sources. If the DEFRA modelling is correct, engine emissions are more to blame than brake, tyre and road wear. To reduce particulates we need to reduce use of diesel and petrol cars across the whole region.
[1] Air Pollution: Key Findings (Cambridgeshire Insight)
[2] Cambridge City Council (Air Quality England)
[3] Background maps for 2015 (DEFRA)
[4] Air Quality Standards (ec.europa.eu)
[5] Ambient (outdoor) air quality and health (WHO)
No comments:
Post a Comment
Comments on this blog are moderated. Your comment will not appear until it has been reviewed.