I think we all realise that home EPCs are not always accurate in predicting energy bills for a house. This is a shame for a lot of reasons. It makes it hard for the government to form housing policy: how do we assess potential energy savings from energy efficiency measures on the housing stock, if we don’t know how bad it is already? It is a shame for people looking to rent or buy a home who want to know what they are letting themselves in for. So why don’t we just measure the energy efficiency instead? Would that it were that simple. The government is well aware of the problem and has provided financial support for some potential solutions making use of smart meter data. The project was called SMETER (Smart Meter Enabled Thermal Efficiency Ratings). The results were promising but not brilliant. Here I explain why it is so hard, and some of the solution strategies.
Whether you are modelling or measuring, the core of the problem is the balance of heating coming in and heat going out. This chart captures the balance from a model of a typical semi detached house with filled cavity walls, double glazed windows and 100mm loft insulation, in the East of England. The model is similar to that used for calculating EPCs. The chart shows month by month heat losses (blue and purple, downwards) through conduction through walls etc and air leakage, balanced by heat gains including solar gains through windows, use of electrical appliances, heat losses from the hot water system (mainly from hot water pipes distributing heat around the house) and of course the heating.
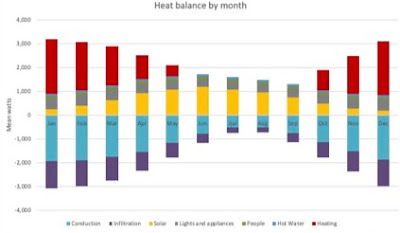
If you look carefully you will see that the gains and losses do not exactly balance. In the summer the gains are much more than needed for losses and at other times some of the gains are not useful because they come at the wrong time of day. You will often get sunny days in spring when you open windows to cool down but in the evening it gets chilly enough that you need the heating again.
With a typical home, you need accurate assessments of both losses and gains.
If you remove the unhelpful gains and add up the months, the overall heat balance looks like this. I have simplified the categories to include just the major gains. In this case, the heat needed (red) is about the same as the total gains. This means to get a good estimate of the heat needed you need good estimates of both the losses and gains. If you have a less well insulated house the losses are much bigger and accuracy on the gains calculations is less critical. Conversely, if it is better insulated you can have solar and other gains supplying most of the heat needed – which makes it even harder to get a good estimate of the remainder to be supplied by your heating system.

There are several different strategies used for estimating energy performance.
- Measure under (mostly) controlled conditions: this means heating the house to a constant temperature for several weeks while the occupants decamp to a hotel or a friend's house. You also need accurate local weather data for temperature, wind and sunshine and you measure the heat needed to maintain the set temperature in the house. For the solar gains, you either have to shade all the windows so there aren’t any gains or survey the windows accurately to model them. Wind affects losses from draughts so very windy days are ignored. This test, called the ‘co-heating’ test, is the ‘gold standard’ for measuring losses accurately but is expensive and very inconvenient for the occupants. The result of this test is the ‘HTC’ (Heat Transfer Coefficient). With this and an understanding of the solar gain you can estimate heat demand and energy.
- Survey only: using measurements and information about the constructions such as what type of walls and window and the amount of insulation – estimate heat gains and losses, hence heat demand and energy use. This is what an energy assessor does to give you an EPC.
- SMETER: estimate the heat transfer coefficient using measurements under normal conditions. This combines data on energy use (such as from smart meters), internal temperatures and weather, possibly combining this with limited survey data. This is the approach used by the SMETER project members.
The survey method estimates losses based on the building fabric.
In the survey method, the energy assessor will measure your house and note the constructions of your walls, roof, windows etc and hence estimate the conductive losses. For the infiltration (i.e. the draughts), you could have this measured with a blower door test or similar, but usually this is estimated based on things like the number of vents and open chimneys, and the level of draught proofing you have put in. This can be very wrong, as there can hidden leaks such as around windows, between floorboards, or behind skirting.
Changing window orientation can change energy use by 10% or more.
Weather is assumed to be typical for the region. For the solar gains, the assessor measures all your windows and notes which way they face. The orientation makes quite a difference. The chart above shows the balance for an East-West orientation which gets very little sun in the winter. In summer the gains are highest when the sun is low – i.e. facing into the windows - in the morning (East) and evening (West). If you have a North-South orientation it looks more like the chart below, with more gains in winter because the sun is low in the South through the main part of the day. This reduces the net heating demand in this house by 12%.

Survey method assumes a standard heating pattern
For the survey method, the assessor assumes a standard pattern of heating because the EPC is a measure of the building, not your chosen lifestyle. Your actual heat demand is heavily dependent on your thermostat settings and program and different households in identical houses can differ wildly. The standard pattern assumes a setting of 21°C in the living areas. If you reduce this to 19°C you lower overall heat demand by 22% and net heating demand by 30% (in this model for this house).
Survey method assumes your heating system efficiency is what it should be.
Finally, the assessor checks what sort of heating system you have and hence the efficiency it is supposed to have, in order to determine how much fuel you need to supply this heat. They also do a similar calculation for hot water demand, again assuming a standard pattern of use.
Survey method inaccuracies
You can imagine that the survey method is not always accurate due to a whole range of reasons such as:
- The wall constructions and types of windows may be uncertain.
- Cavity wall insulation or loft insulation may have gaps.
- Defects may lead to extra draughts or damp patches; often draughts are dependent on the wind direction as well as wind speed so a single figure for air tightness is an over-simplification.
- There can be significant heat transfer through party walls to neighbours, depending on their temperature relative to yours, but this is not known and ignored.
- The heating system may be configured poorly or be old and scaled up, which means it is not as efficient as it should be. This can add 10% or more to the bills.
Alternative strategies
These diagrams illustrate the 3 different strategies. The co-heating test one is quite simple: measure weather and heat input (100% efficient electric heaters), either eliminate or estimate the solar gains, calculate the fabric heat loss (yellow).
 |
| Co-heating test: the result is the HTC. solar gains can either be minimised by shading or modelled based on a survey of the windows. |
 |
| EPC (left) to estimate fuel demand versus SMETER methods (right) to estimate fabric heat loss. In SMETER, there are different approaches to handling hot water and solar gains. |
The SMETER results can be used to improve the EPC rating.
The EPC assessment aims to estimate fuel demand while the SMETER assessment measures the heat loss (HTC) so the final result is a bit different. However, having got the HTC you can plug that into the EPC model and compute the standardised fuel use, the same as on your EPC. So SMETER techniques can theoretically be used to improve an EPC. (I have glossed over the difference between infiltration losses, which depend on wind speed, and conductive losses, which do not.)
SMETER techniques vary in how they handle solar gain and hot water.
The SMETER assessment still requires survey data for an estimate of the heating efficiency, but this is not the trickiest bit. For solar gains you have several options. You can use statistical techniques to separate the variation in heat that relates to sunshine (solar gains) from that which relates to temperature (the HTC) but doing that properly requires quite a lot of data points which means a lot of days. Or you can use smaller time intervals but then it becomes very important to take into account the thermal inertia of the house itself, which is also tricky. Or you can use the EPC approach and model the solar gains which requires data on window size, orientation and type, from survey data.
For the hot water, you can ask the occupants how many baths and showers they take, but there is a lot of variation in showers and baths and it is difficult to ask personal questions like this; you may not get accurate answers! Ultimately you have to make some assumptions and add in some uncertainty to the result. Hot water is important mainly as another source of heat demand rather than as gains.
The most accurate SMETER assessments used survey data for windows.
So how well did SMETER assessments do? There were eight projects reported in the final technical report taking a variety of approaches. The best performing were from Build Test Solutions and Switchee and both of these used survey data for windows to estimate solar gain, as well as smart meter data and temperature sensors. They 'passed' the test (see below) in 93% (BTS) and 97% (SWI) of cases, with a mean error of around 15% and a bias of less than 3%. The worst one used smart meter data only. It passes only 70% of the time and the mean error was nearly 40%. The one I was involved in (CAR) used smart meter data plus either temperature sensors or smart thermostat data (the report says we needed both but this is incorrect.) We were in the middle of the pack with a success rate of 85% and a mean error of 20%.
That does not mean that BTS and Switchee were the best solutions. That rather depends on how accurate you want the result to be, how long you are prepared to wait for it (some of the tests took weeks) and how much you are prepared to pay for it.
Solar power and/or heat pumps would make the task harder unless they are fully metered.
The task set in this competition was relatively straightforward. There were 30 homes, all semi-detached, or end-terraced with one or two stories and a gas boiler as the sole heating source. The results were compared with a co-heating test result. Success meant that the SMETER estimate of HTC , with uncertainty bands, overlapped that of the co-heating test and we were also compared on the average size of the error
The task could easily be harder. With PV panels on the roof there is additional uncertainty on how much electricity has been used, because most installations have meters for generation but not export. Also, replacing the gas boiler with a heat pump can introduce more uncertainty because the efficiency of a heat pump varies considerably with external temperature and heating load. That is not a problem when the heat pump has a heat meter and an electricity meter (mine does). Personally, I think all heat pumps should have these meters because they are essential for verifying the performance of the heat pump as well as the performance of the house.
[1] Technical Evaluation of SMETER Technologies (TEST) Project (www.gov.uk) Jan 2022
Hmm, the predictions of PHPP seem to be quite accurate in my experience. Just saying ...
ReplyDeletePHPP is an excellent modelling package. Combined with good build quality it will give good predictions. However, it is only as good as the information provided and a PHPP model for an existing home will cost more than a standard EPC. You get what you pay for.
Delete