Over the first winter my heat pump (space heating only) gave me an average COP (efficiency) of 3.1 which was higher than I had been told to expect. I was moderately pleased. This winter it was only 2.9 which was a great disappointment.
The difference is due to the weather. The mean COP for one year is not necessarily a guide to the next. The mean temperature is part of it but colder days require proportionately more heat, which biases the average COP. So I have done my best to work out what the average COP should be over time. I was surprised at the year to year variation.
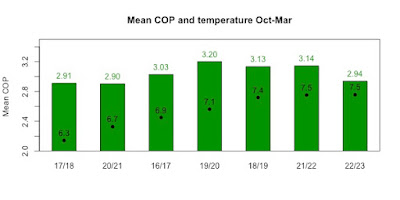
Over the last 7 winters, I estimate my mean COPs would range 2.9 to 3.2
I only have two winter seasons of heat pump data, but I have seven years of daily mean temperature data. To see how much variation I can expect I estimated the mean COP I would have got in all seven years, based on heat pump performance in the last winter. (For the interested, I explain more below). I did not use the winter 2021/22 because during that period I did quite a bit of tweaking on the thermostat and weather compensation controls. This chart shows the mean COP estimated for each season, ordered by increasing mean temperature. This last winter was the warmest of them all but there were some very cold days. The overall average COP is 3.04 which is slightly higher than the prediction on the MCS installation certificate (2.96).
 |
| Mean COP (green bars) by mean temperature (labelled black dots) for the last seven winter seasons, in order of increasing temperature. |
To illustrate the impact of cold days, here is a histogram showing the proportion of days by temperature and the proportion of heat delivered by temperature. You can see that at the cold end the proportion of heat delivered (blue bars) is higher than the proportion of days (green) and at the warm end it the opposite applies. The cold days have a greater effect on the mean COP.
 |
| Proportion of days and total heat delivered by temperature for 2021/22. Cold days need proportionately more heat. |
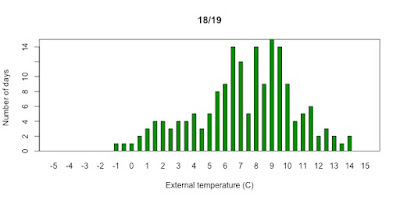
Winter seasons for 22/23 and 18/19 have almost the same average temperature but the spread of temperatures is very different. During 2022/23 there were lots of cold days, which is why the mean COP is lower.
 |
| Number of days by temperature, in half day intervals for 2022/23 |
 |
| Number of days by temperature, in half day intervals for 2018/19 – which has similar mean temperature as 2022/23 |
Heating energy demand varies anyway - but more so for heat pumps.
Heating energy demand will vary between winters anyway but the fact that heat pump efficiency varies with temperature increases the variation you can expect. Different heat pumps could be affected differently depending on how they are optimised and configured.
Do not rely on a single year of performance data.
If you are monitoring the performance of your heat pump, then you need to bear in mind that mean COP will vary year to year. In my case the variation is up to 10% between the best and worst years. So if you get disappointing efficiency in your first year this may be due to weather rather than a poor installation. It is much more useful to look at COP versus external temperature, if you have that level of monitoring.
Heat pumps efficiency ratings are for an 'average' climate.
If you are purchasing a heat pump, you may be interested in comparing different products for efficiency. The energy rating that appears on heat pump EU energy labels, is based on the SCOP for an ‘average’ European climate - nominally the climate for Strasbourg. The EU standard defines the climate in terms of heating hours by temperature in a typical year. This lowest temperature is -10 (!) and there are a total 100 hours below -5°C. (Note this is hours, not days, but even so it is more extreme than our weather. This is what you get with a continental climate.) When you see SCOP values reported in brochures this is usually for Strasbourg. Heat pump designs can be optimised for part load performance or for cold weather in various ways. This means when comparing products, relative performance for Strasbourg may not translate exactly to relative performance for your climate. Your installer should have the information needed to give more detailed advice.
If you get an estimate of energy consumption for your new heat pump it might be worth asking how that has been prepared. Have they calculated performance for your local climate, or just used the European average?
Most of this is obvious when you think about it - but the impact was larger than I expected.
How I calculated the mean COP for previous years.
For my heat pump data I have daily heat and electricity use in kWh (manual readings). For temperature I download hourly weather data from a local weather station and find the average for the day. This is actually 7am to 7am rather than midnight to midnight as I take the readings when I get the tea in the morning.
I rounded the daily mean temperatures to half a degree and calculated the mean heat delivered, electricity used and hence the mean COP for each temperature. This was a bit bumpy, at the extremes where there were fewer points so I smoothed it (see chart).
Then, for each of the other years, I matched up heat and electricity with the rounded temperature for each day. Finally, I aggregated heat and electricity needed for each season and dived heat/electricity for the mean COP.

No comments:
Post a Comment
Comments on this blog are moderated. Your comment will not appear until it has been reviewed.